Management Console
The GreptimeDB Enterprise Management Console extends the open-source GreptimeDB Dashboard with enterprise operational capabilities. The sidebar is organized into two groups:
| Group | Scope |
|---|---|
| Data Management | Query, ingest, and manage data — same features as the open-source Dashboard |
| Operation | Cluster observability and administration — enterprise only |
Data Management
Data Management covers query, ingest, pipelines, Flow, and Visualization — the same features as the open-source Dashboard. See GreptimeDB Dashboard for details.
Operation
Operation provides enterprise-only tools for cluster observability and administration.
Overview
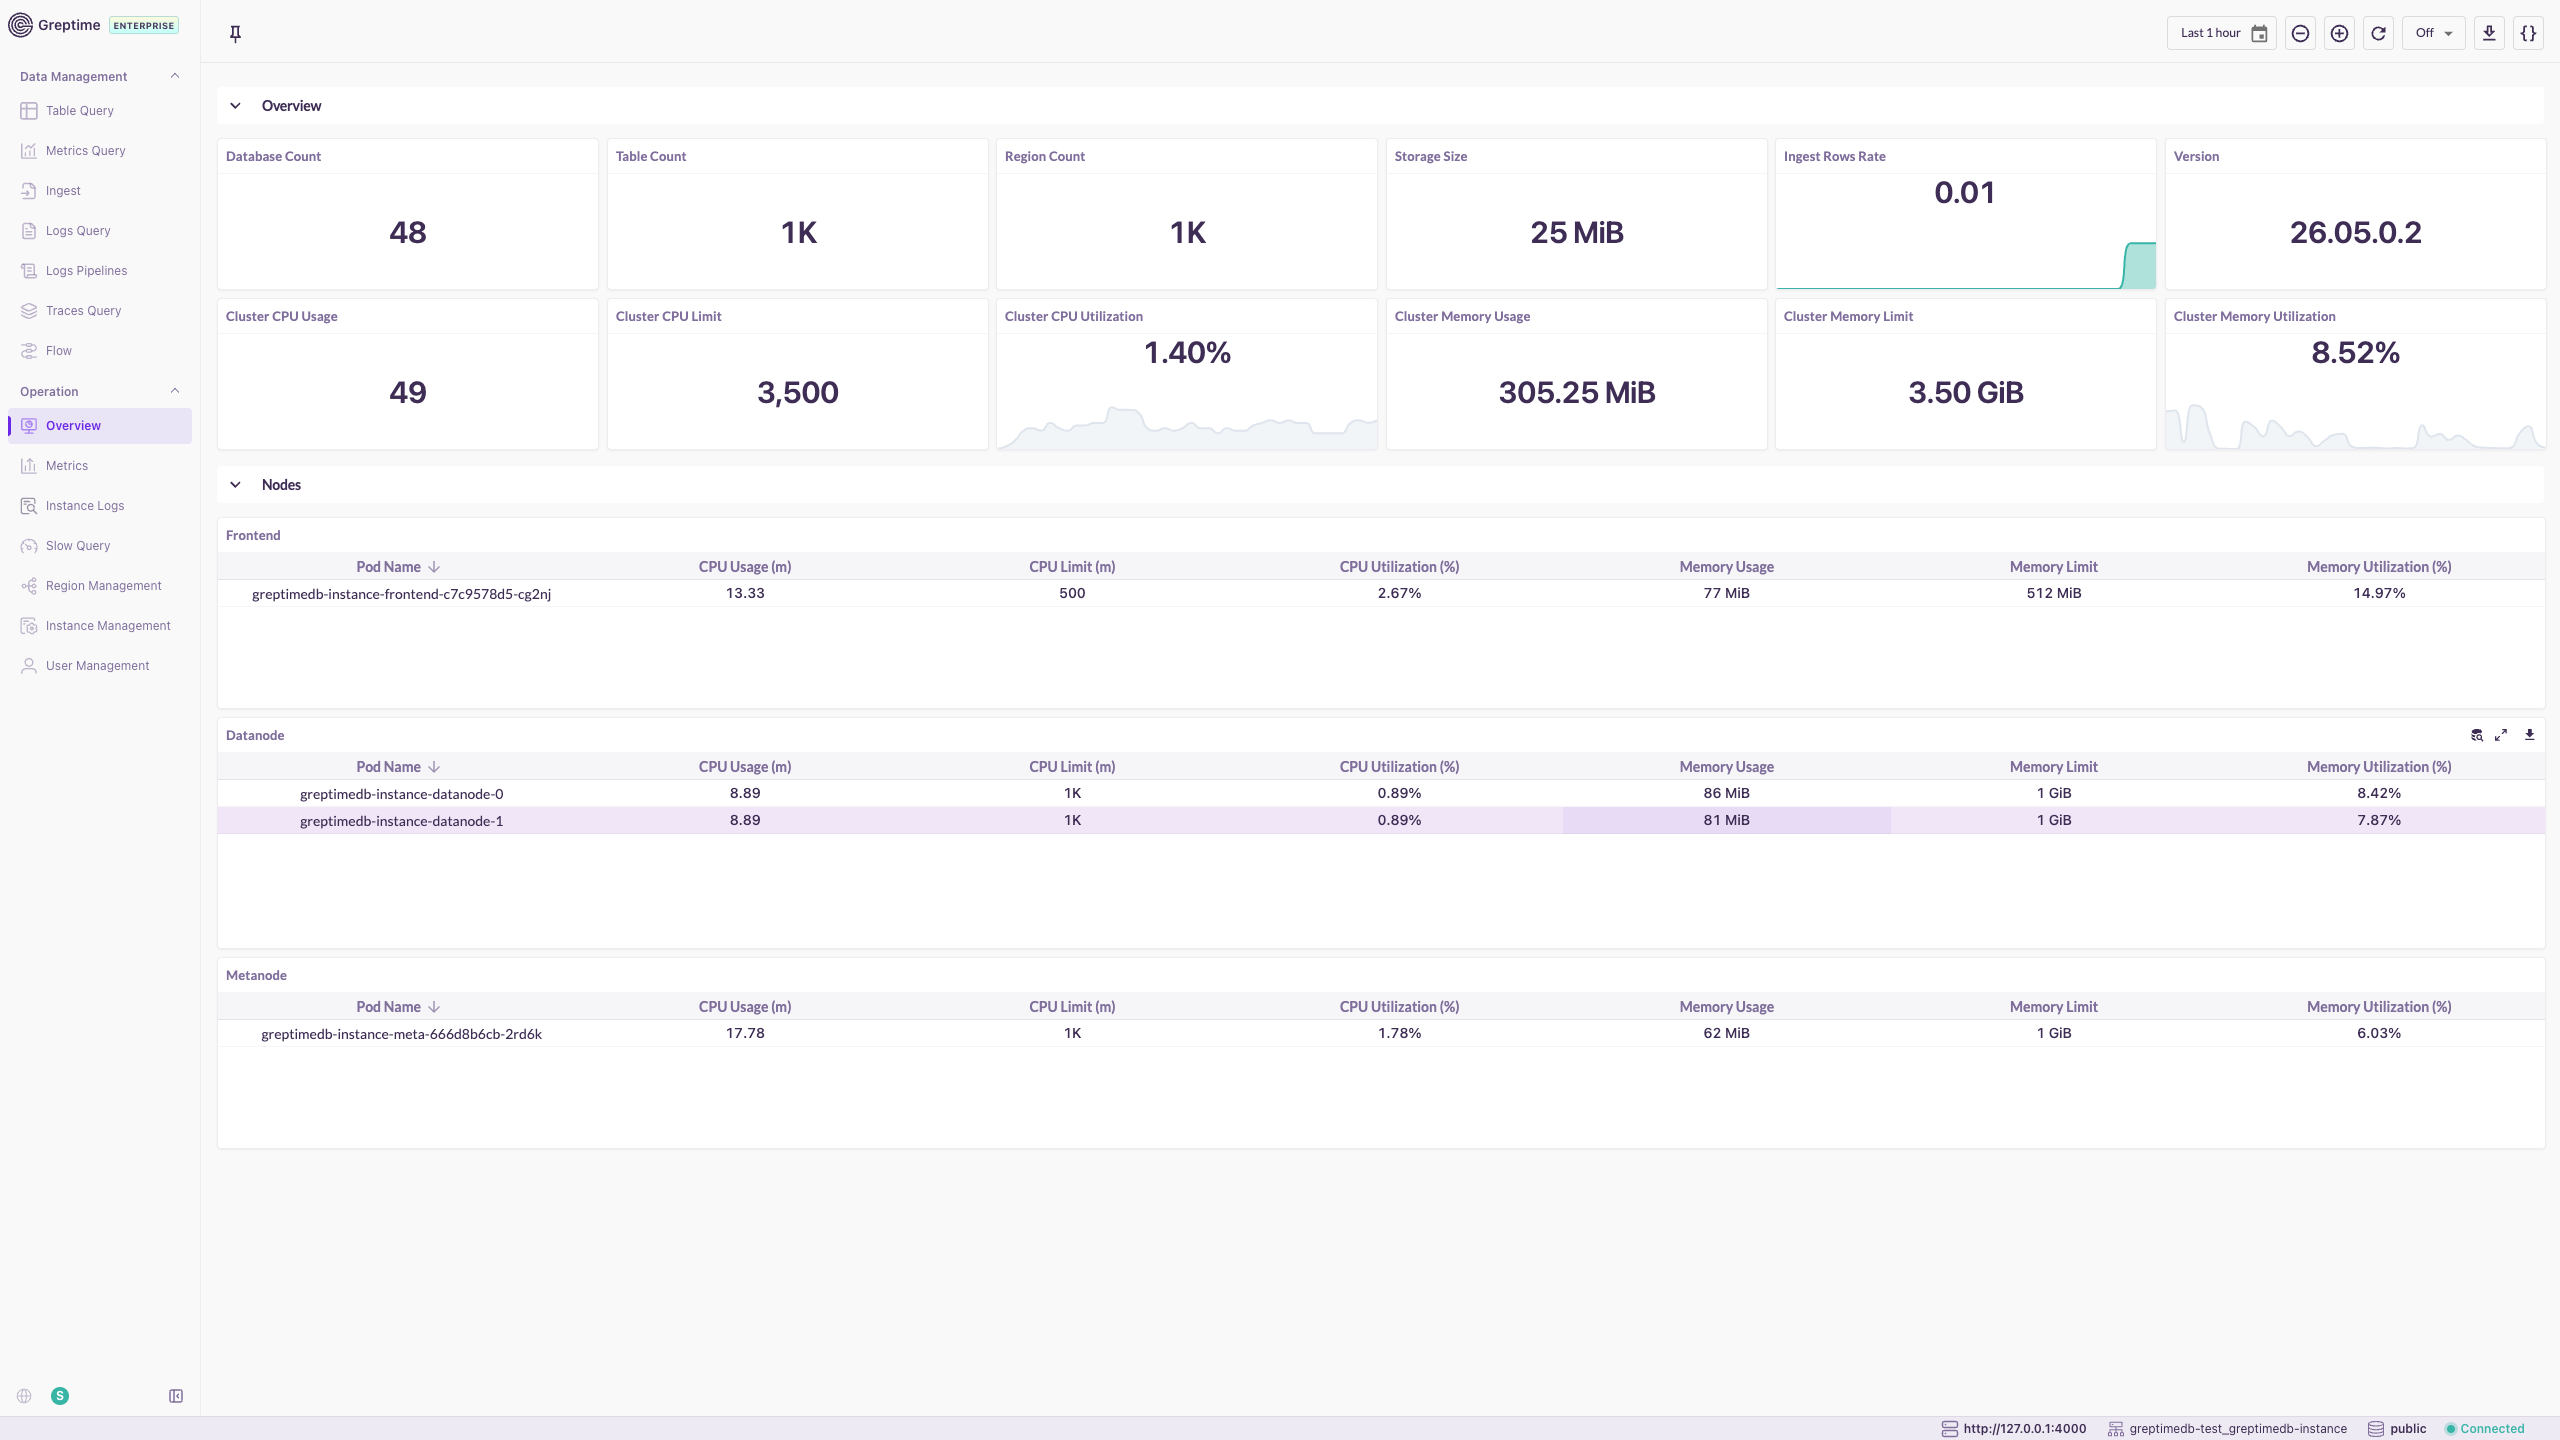
The Overview page displays cluster-wide status and resource usage.
- Database, table, and region counts; storage size and ingestion rate.
- Cluster CPU and memory usage with utilization trends.
- Per-node breakdown by role (Frontend, Datanode, Metasrv, Flownode).
Metrics
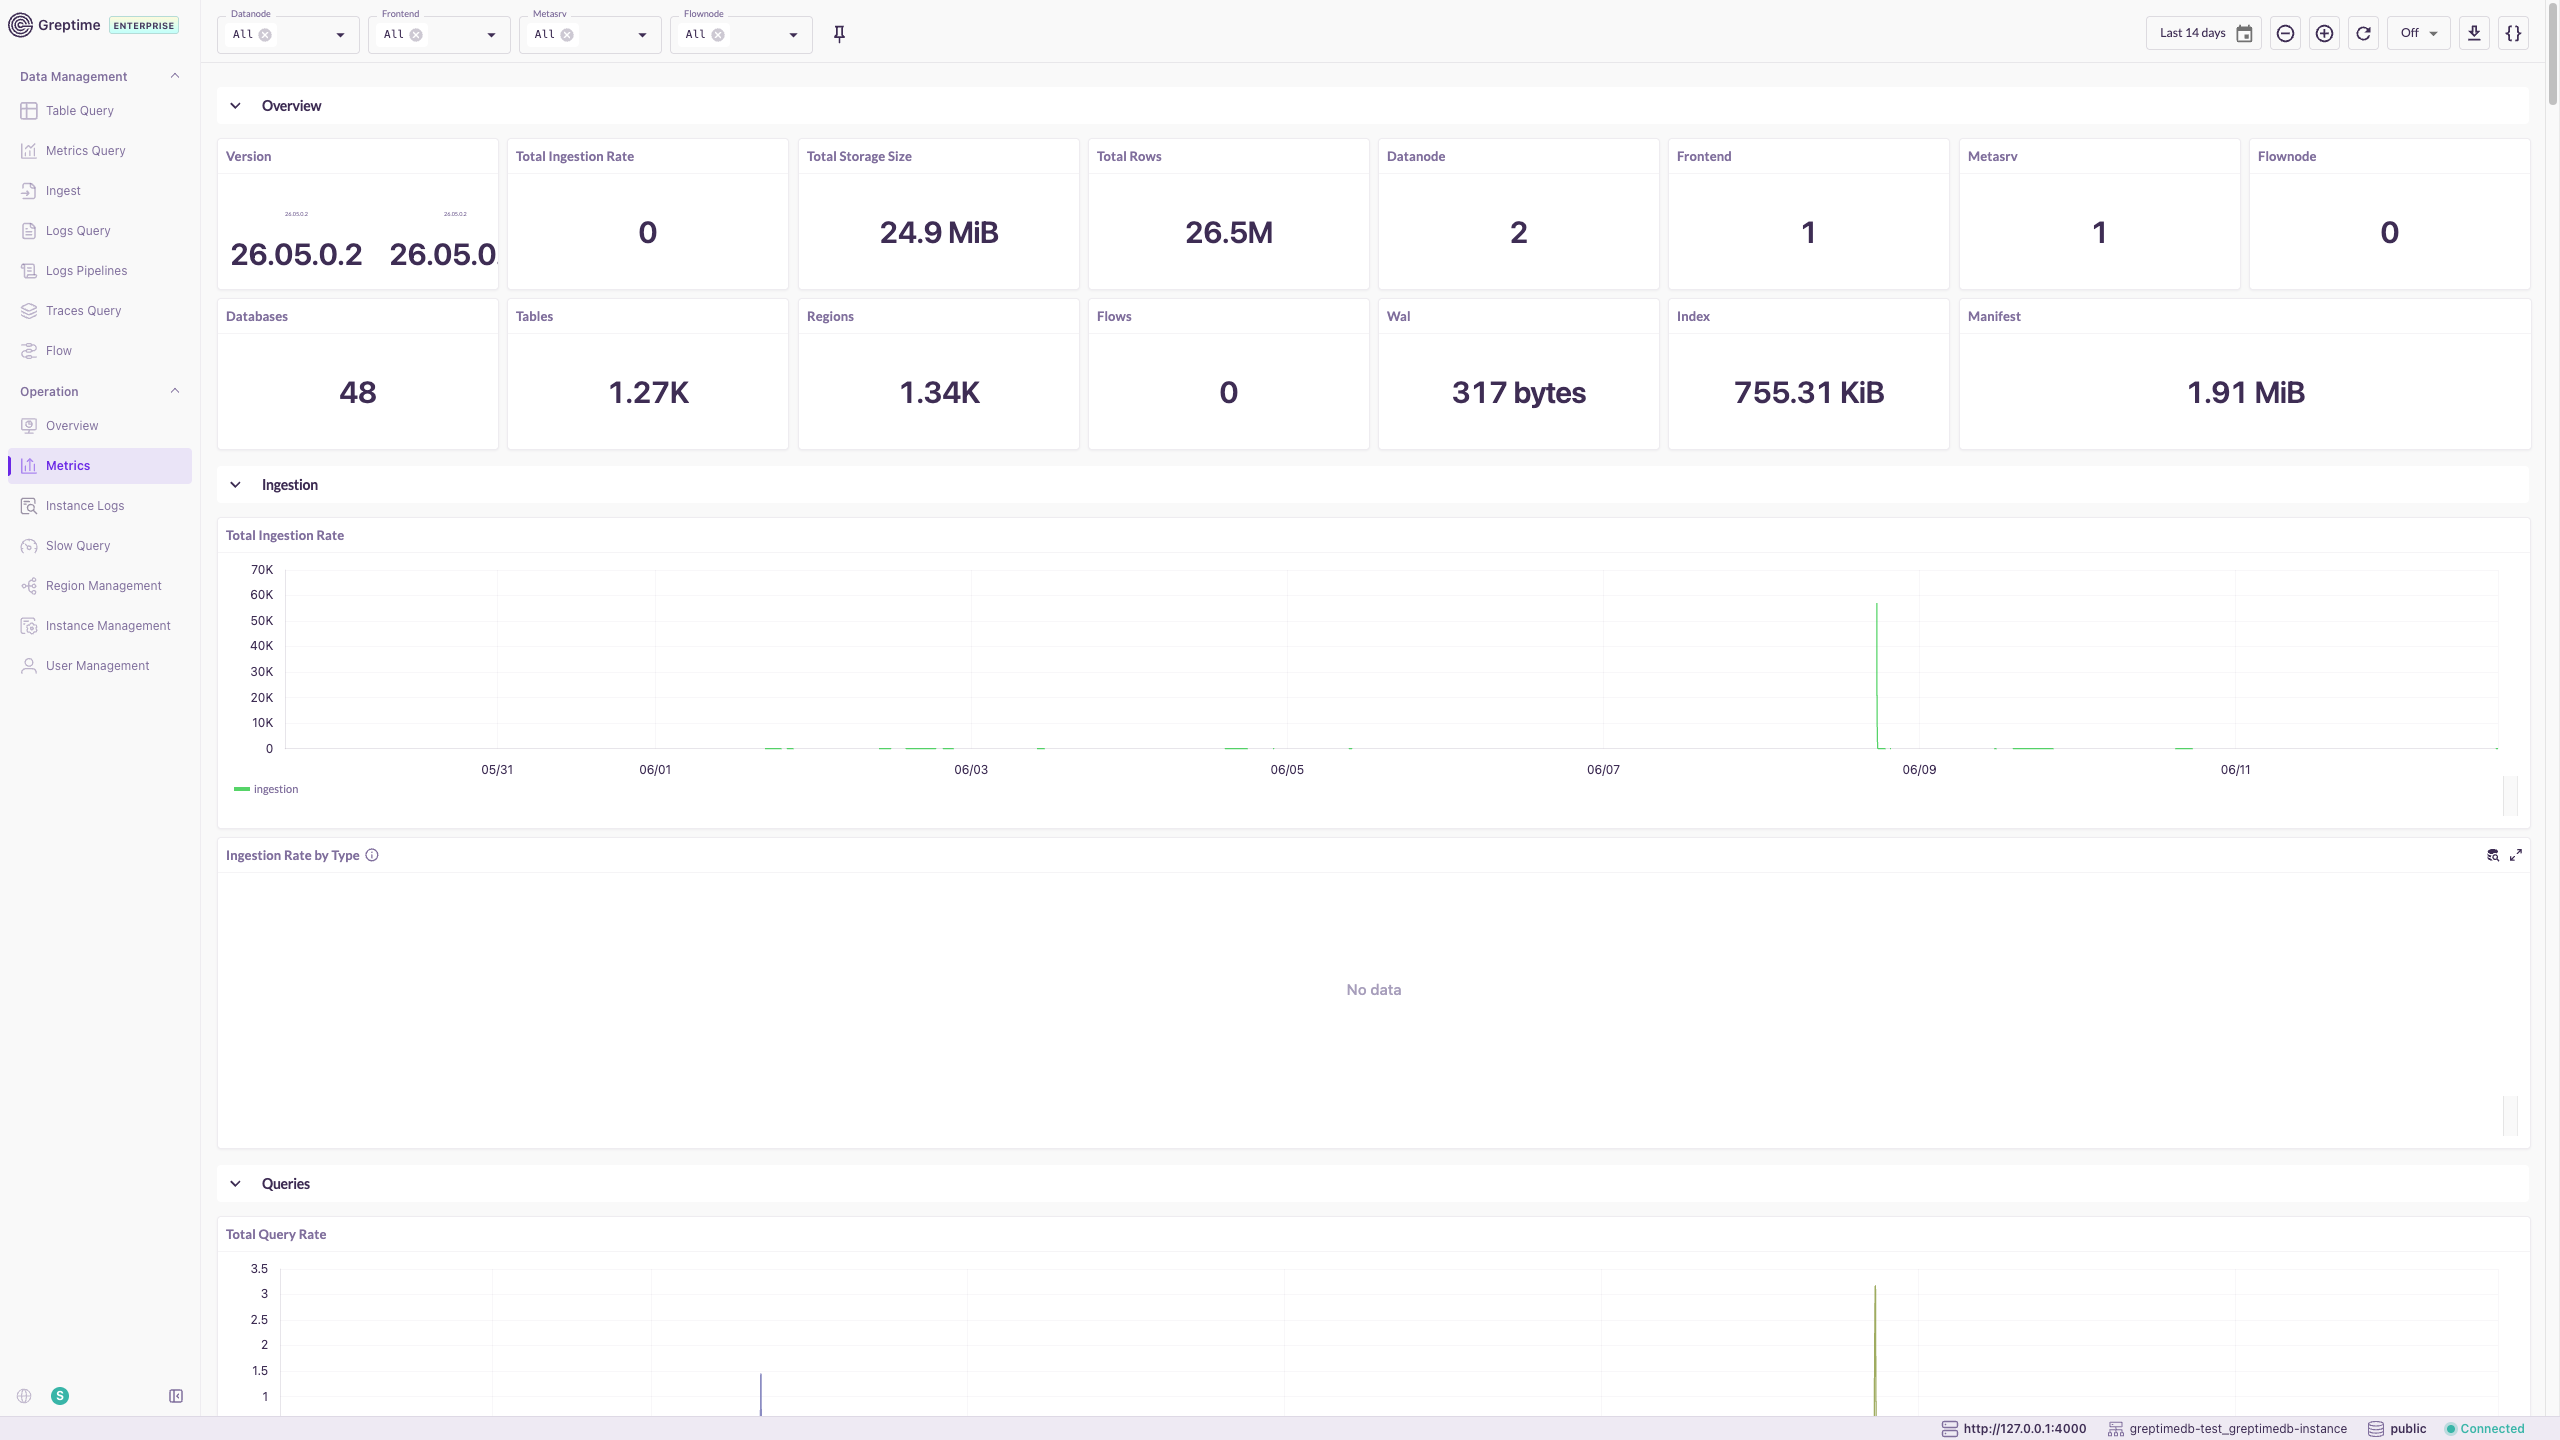
The Metrics page shows cluster operational metrics in a single built-in monitoring view, organized into Overview, Ingestion, and Queries sections.
- Filter by node role and time range.
- Covers request rates, latency, storage, and resource utilization.
Instance Logs
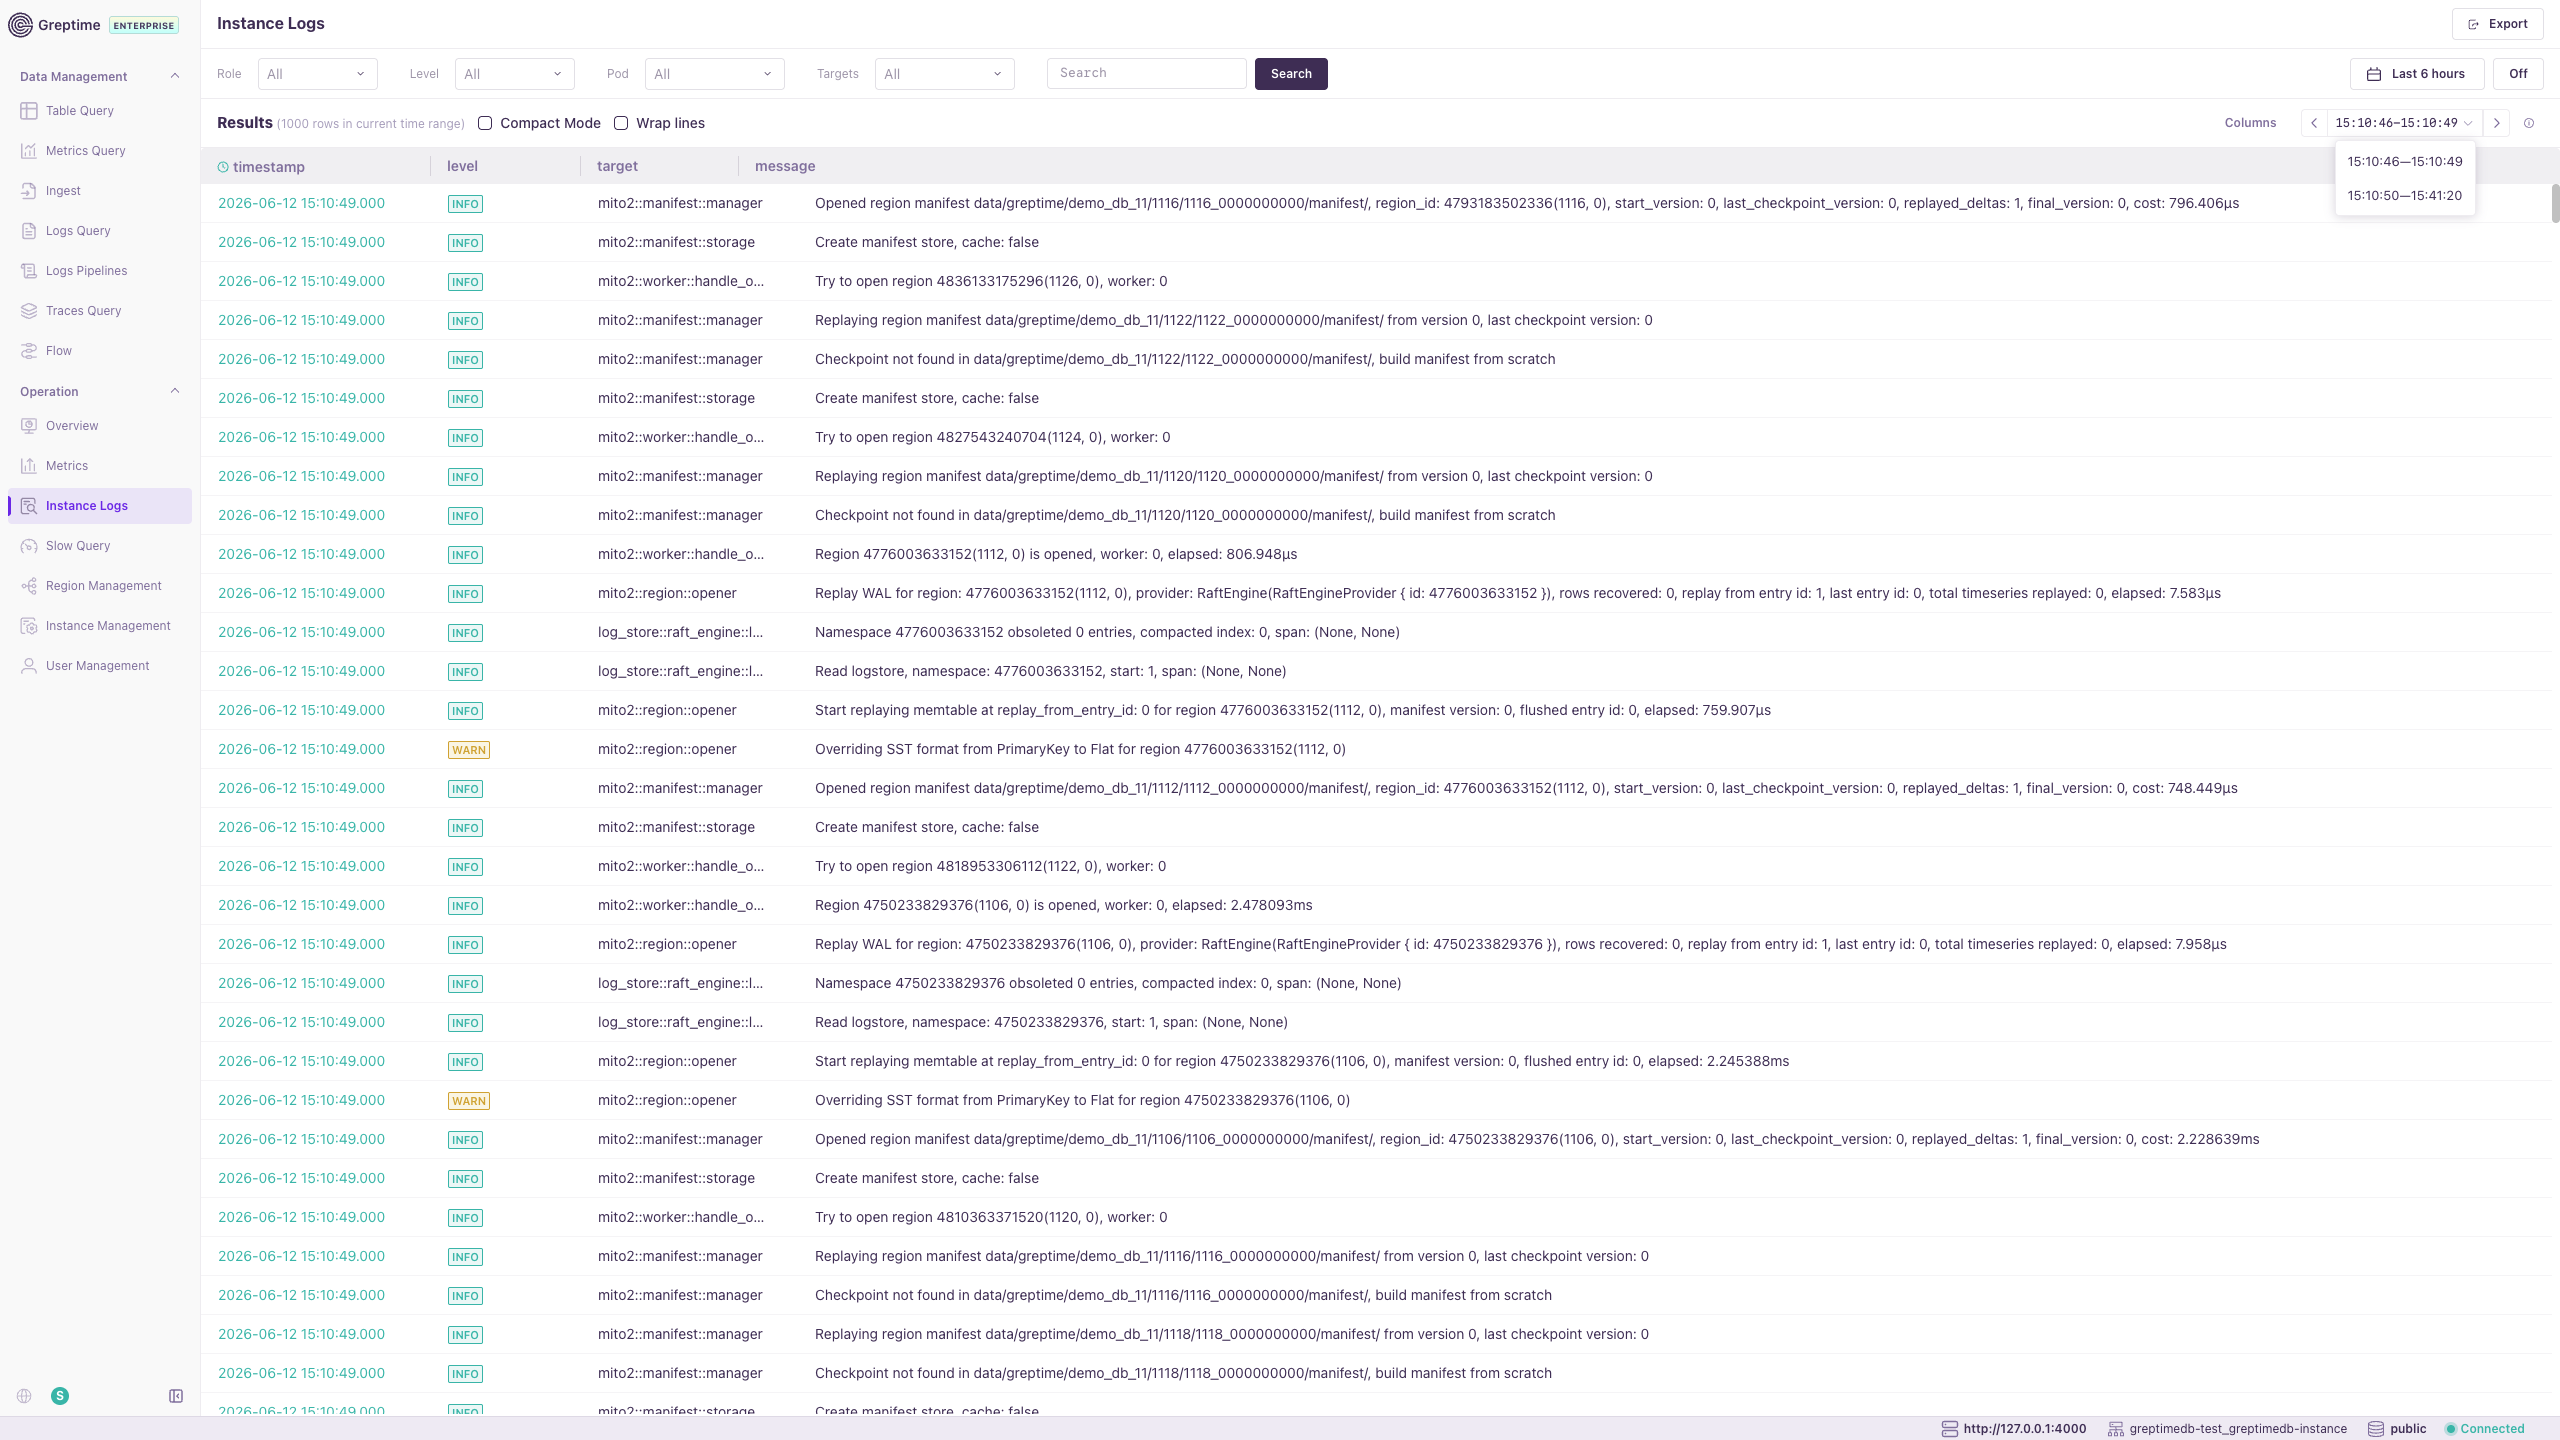
Instance Logs enables log search and analysis for GreptimeDB components.
- Filter by role, instance, log level, time range, and keywords.
- Export results for further analysis.
Slow Query
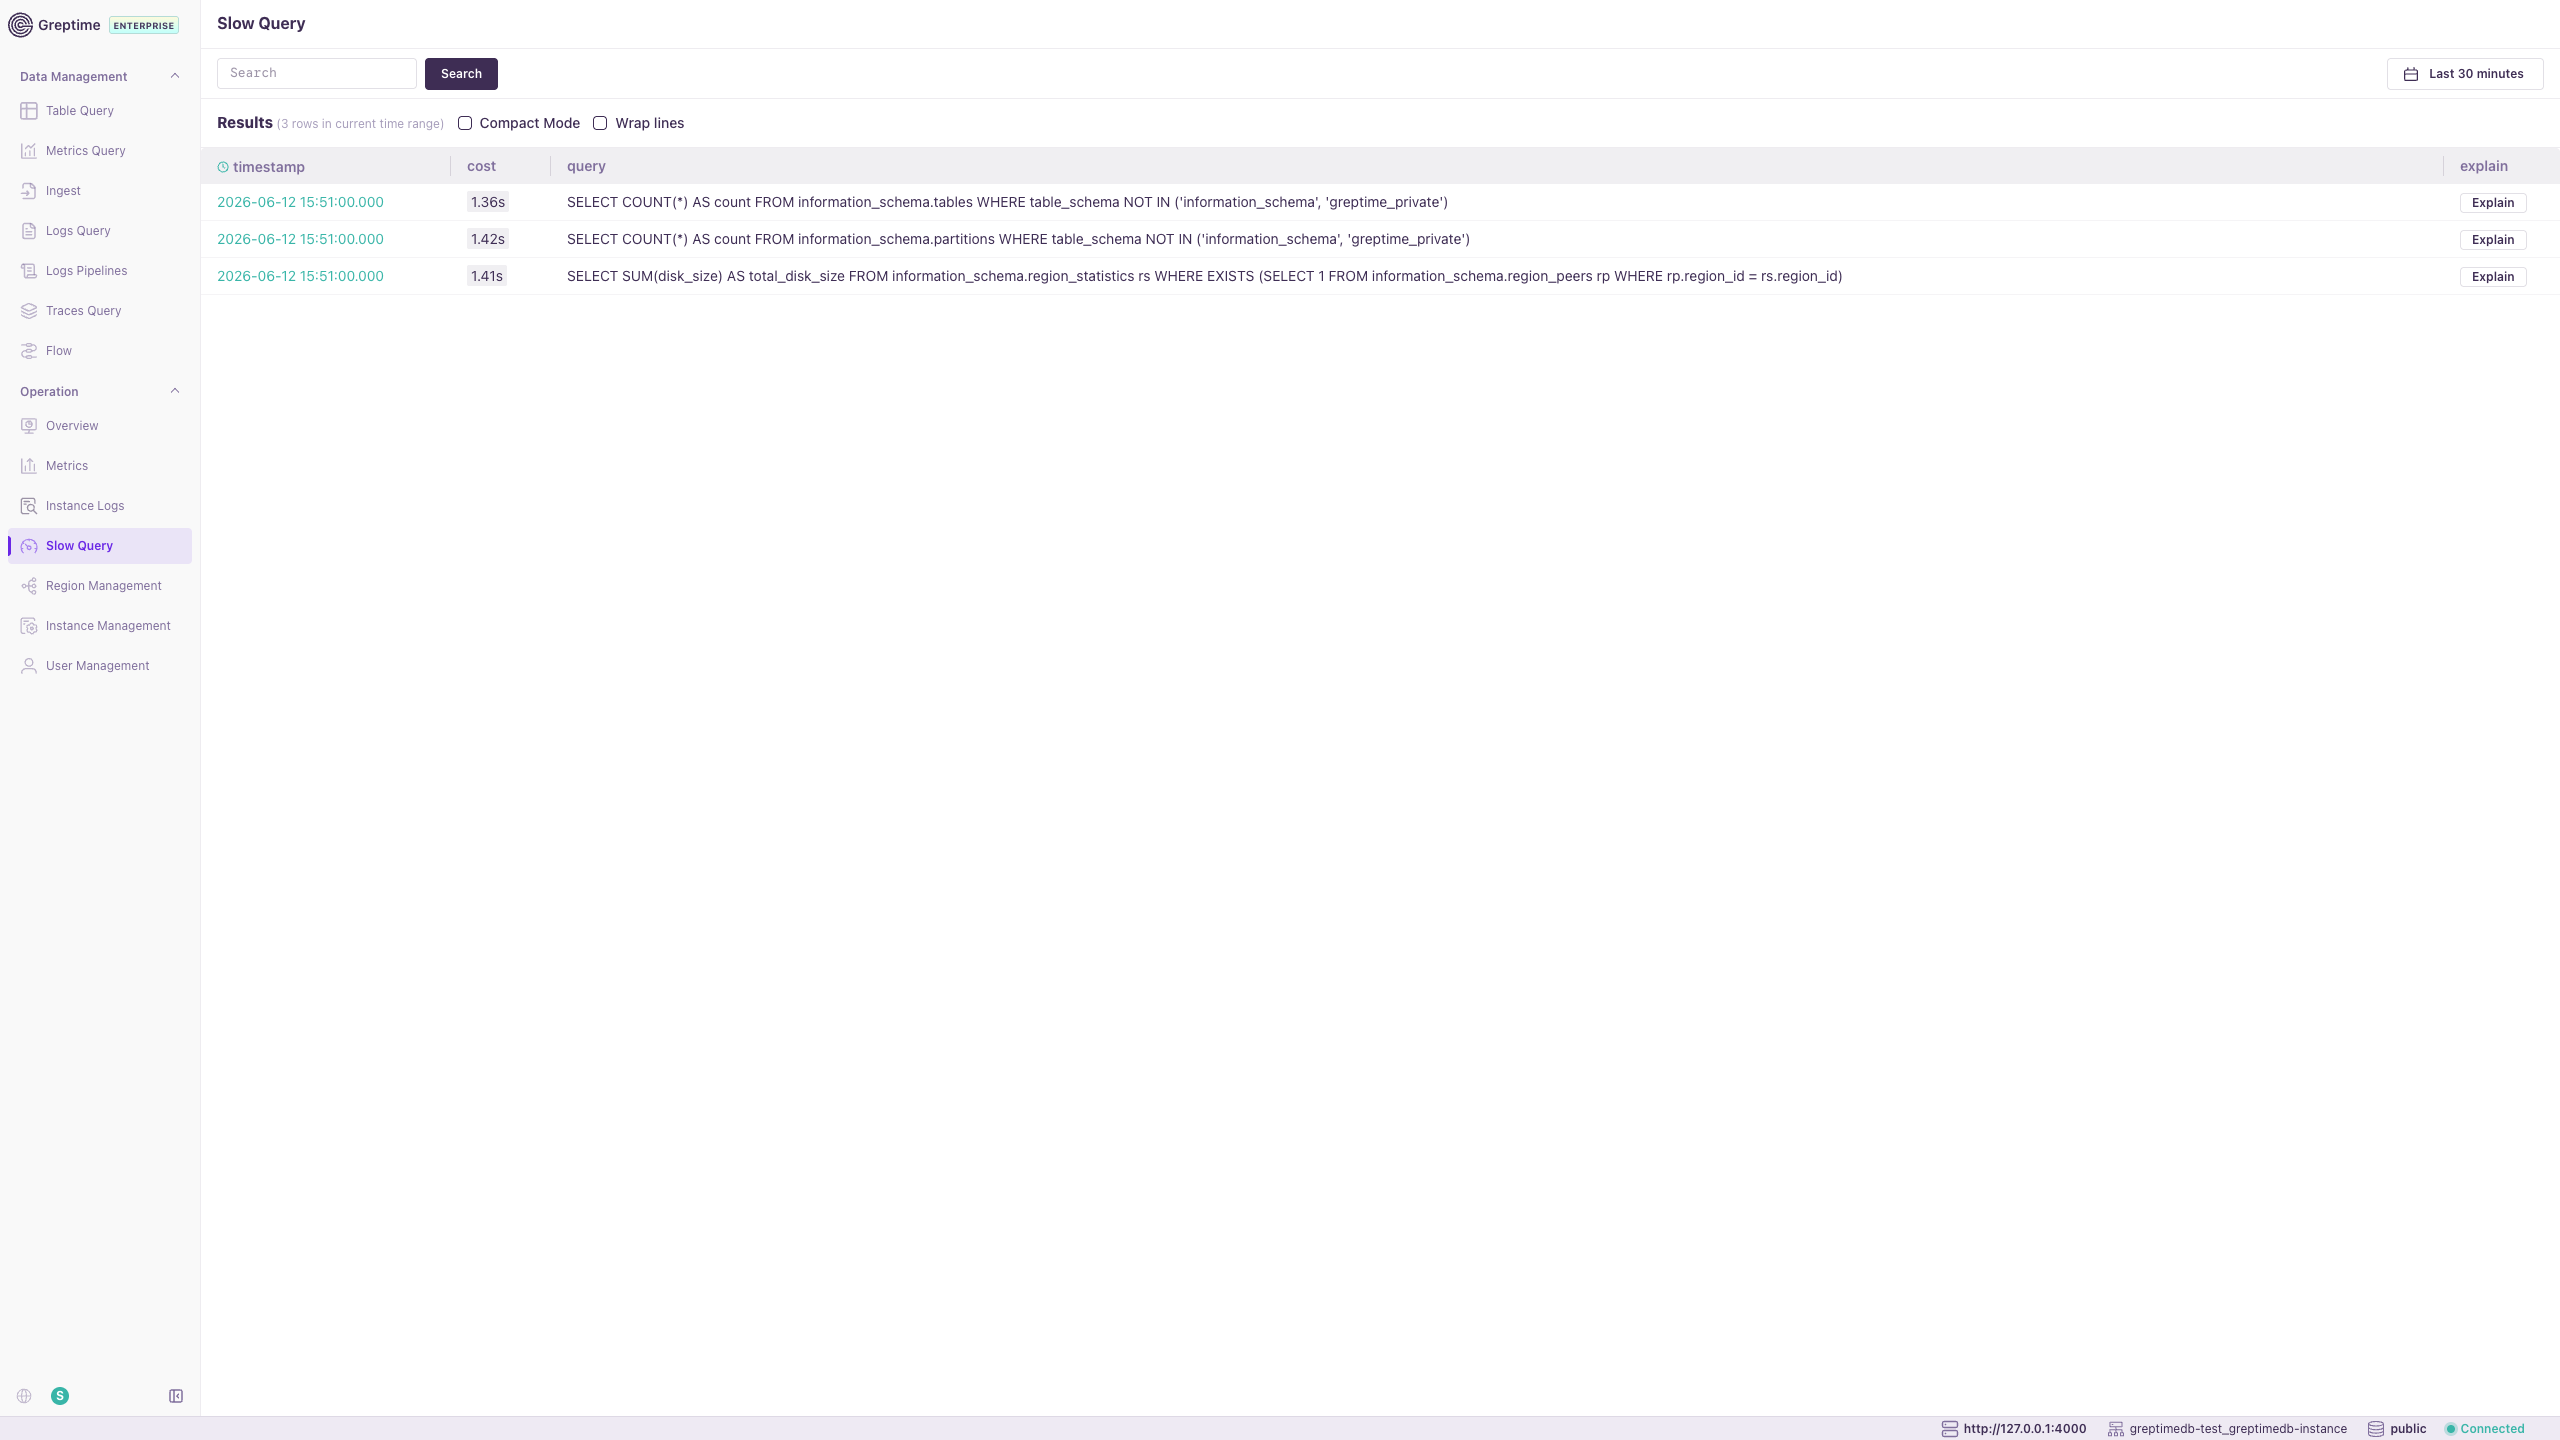
Slow Query lists long-running SQL and PromQL queries.
- View execution time and full query text.
- Use Explain Query to analyze execution plans and optimize performance.
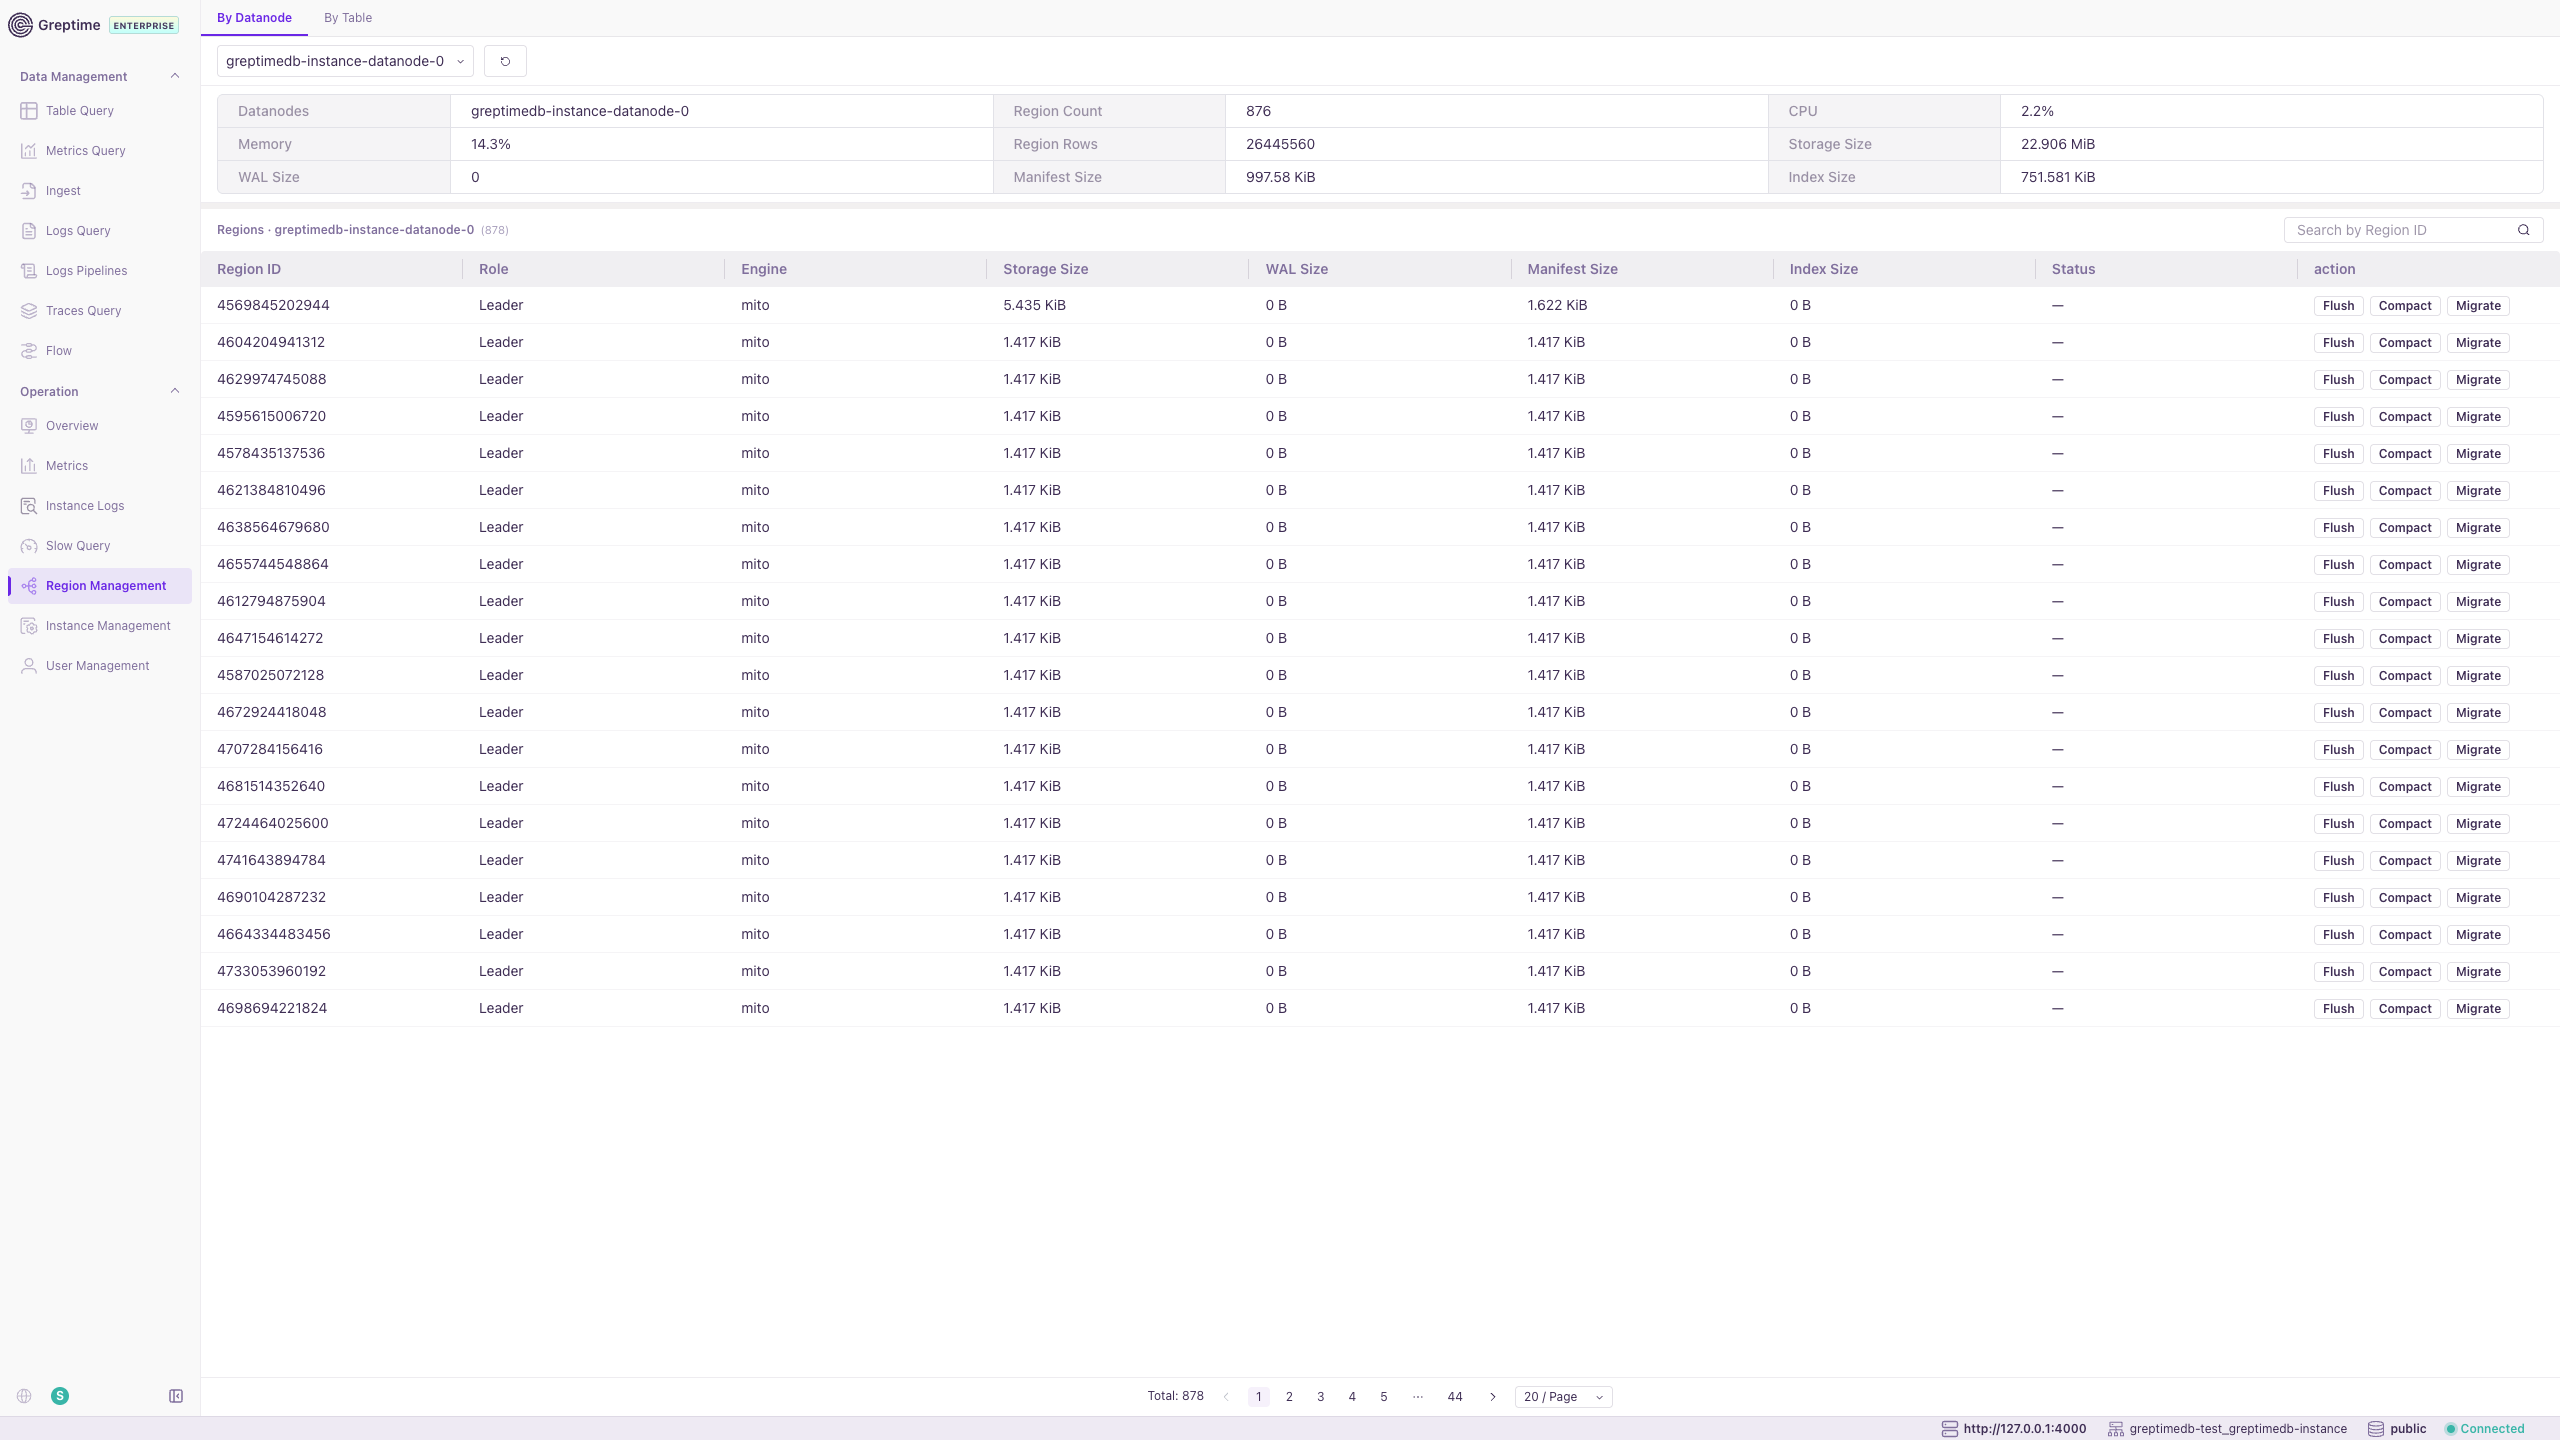
Region Management
Region Management provides region-level operational capabilities.
- By Datanode and By Table views for region distribution and details.
- Flush and Compact operations to optimize storage and performance.
- Migrate regions between nodes with progress tracking.
Instance Management
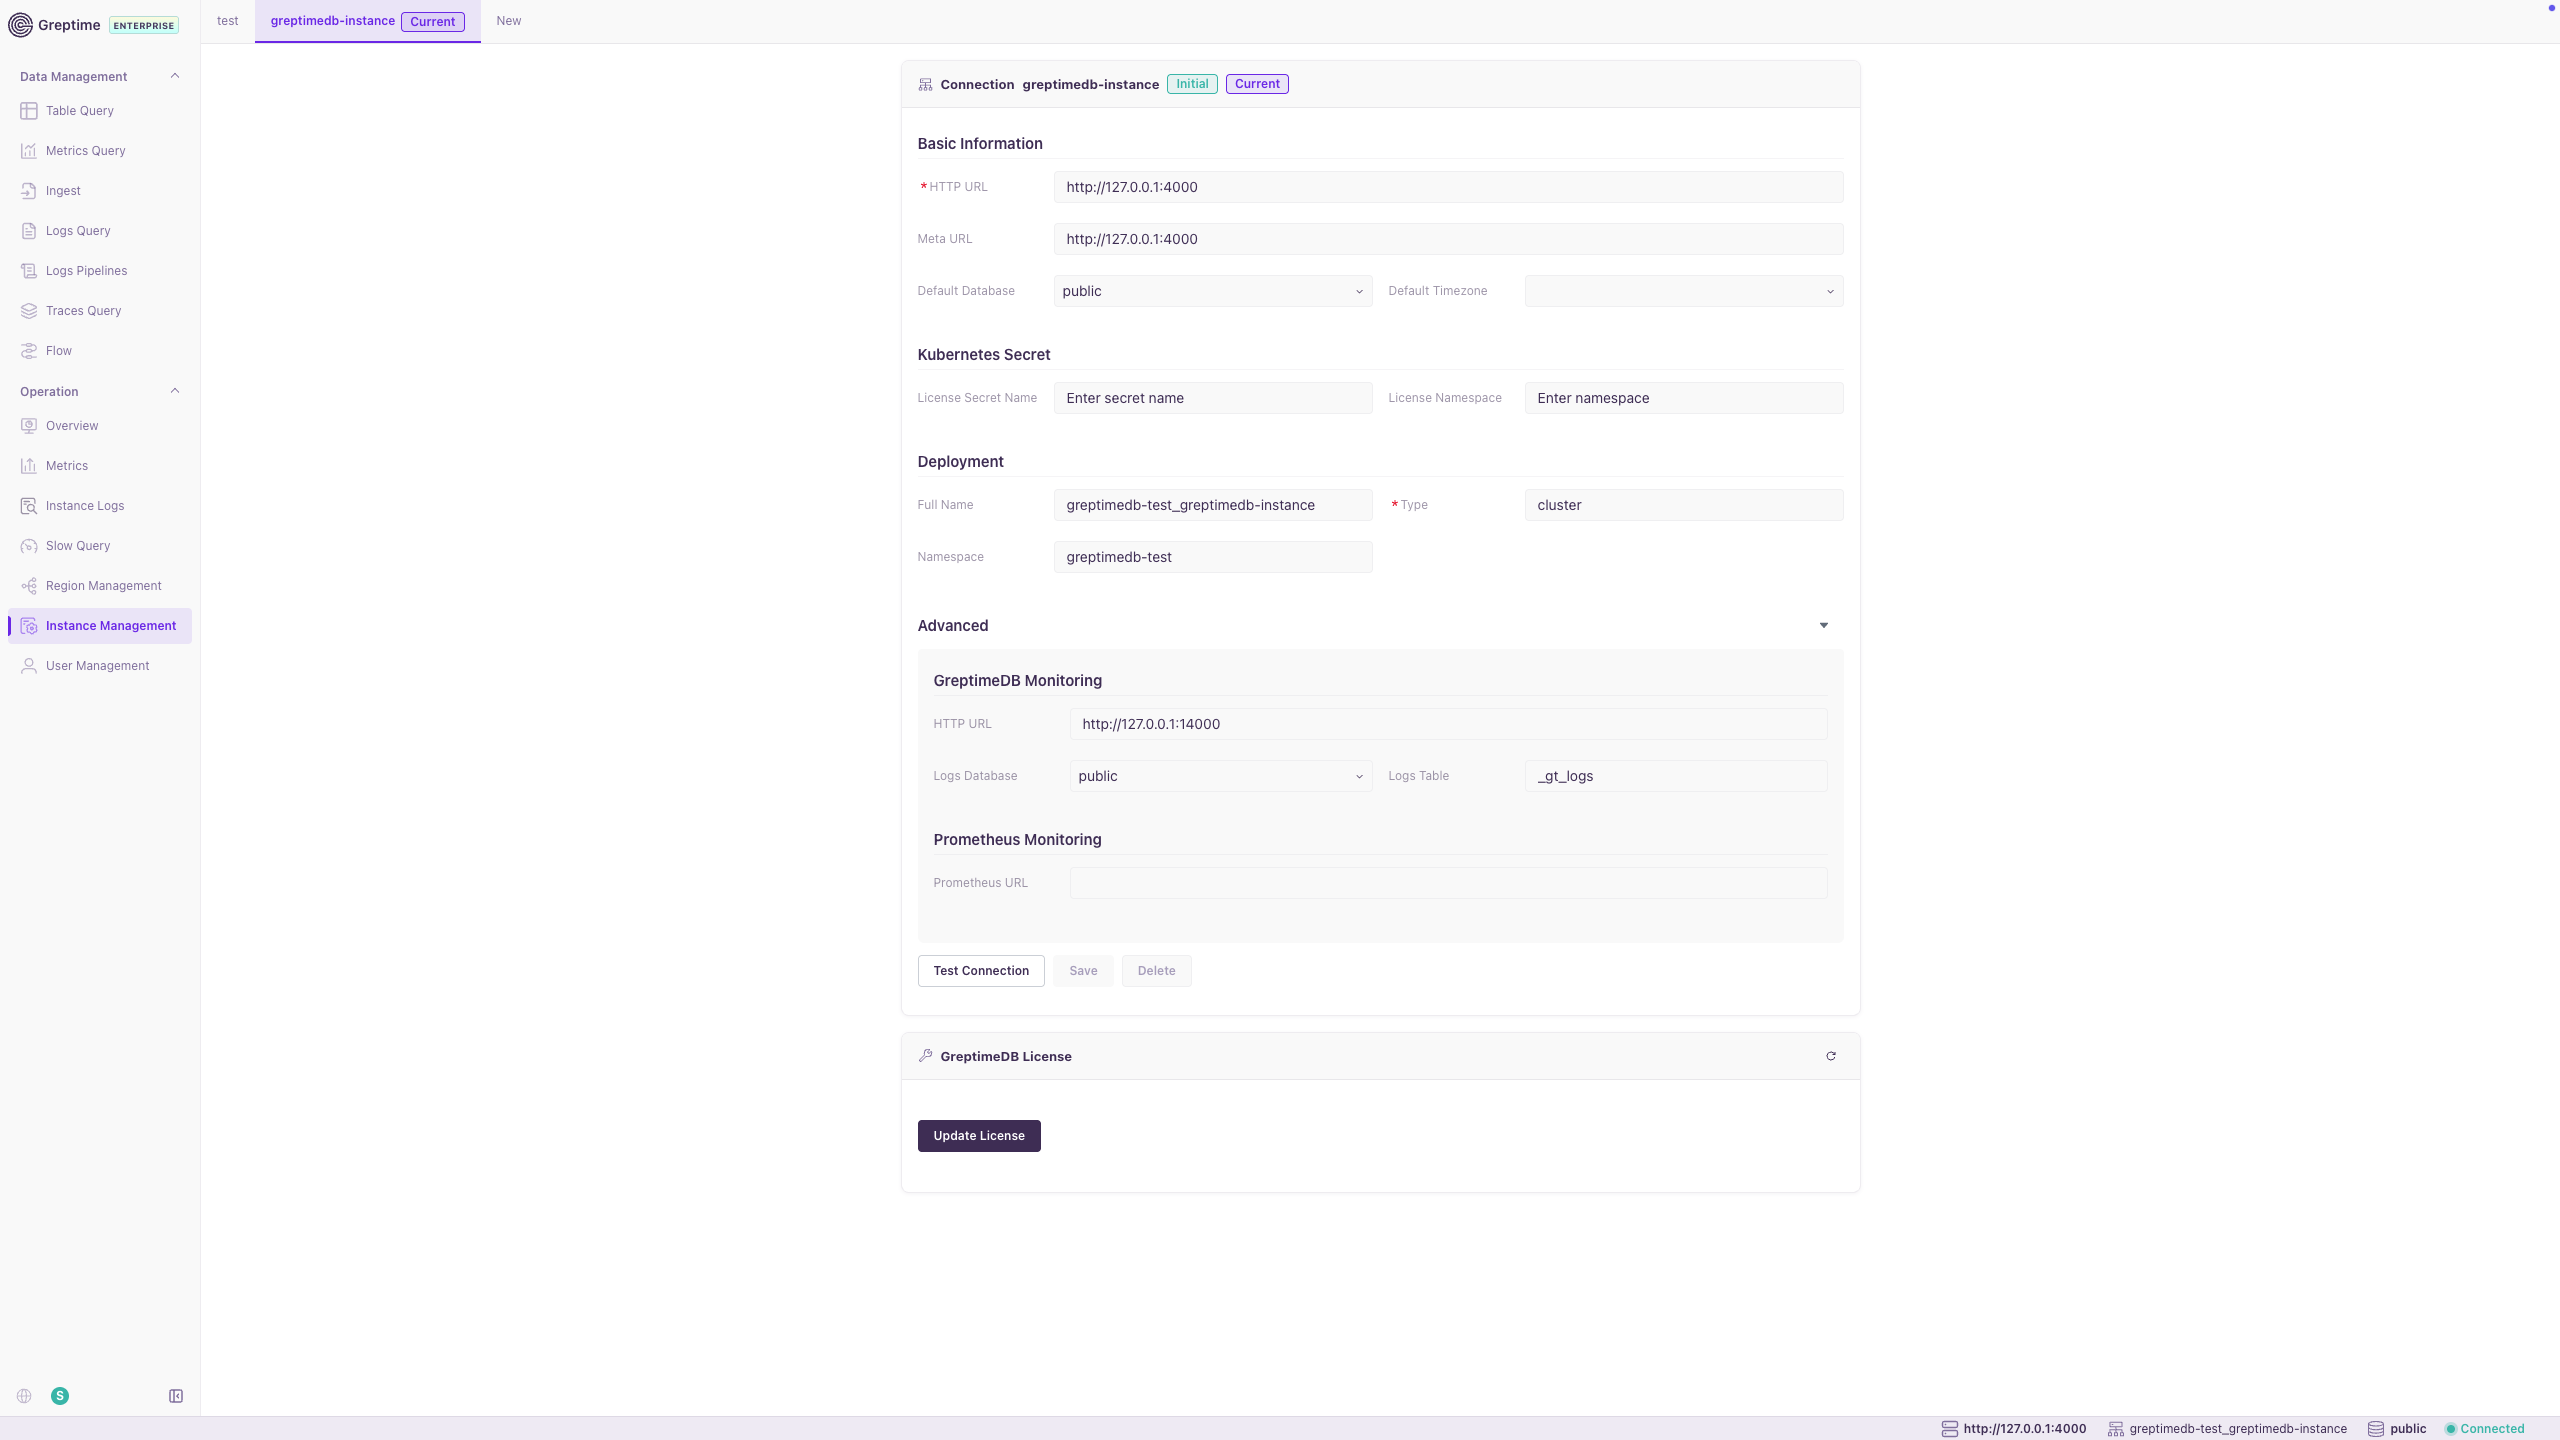
Instance Management configures connections to GreptimeDB clusters.
- Set HTTP URL, Meta URL, default database, and timezone.
- Configure Kubernetes license secrets and deployment metadata.
- Configure GreptimeDB and Prometheus monitoring endpoints.
- Test Connection, Save, and Update License actions.
User Management
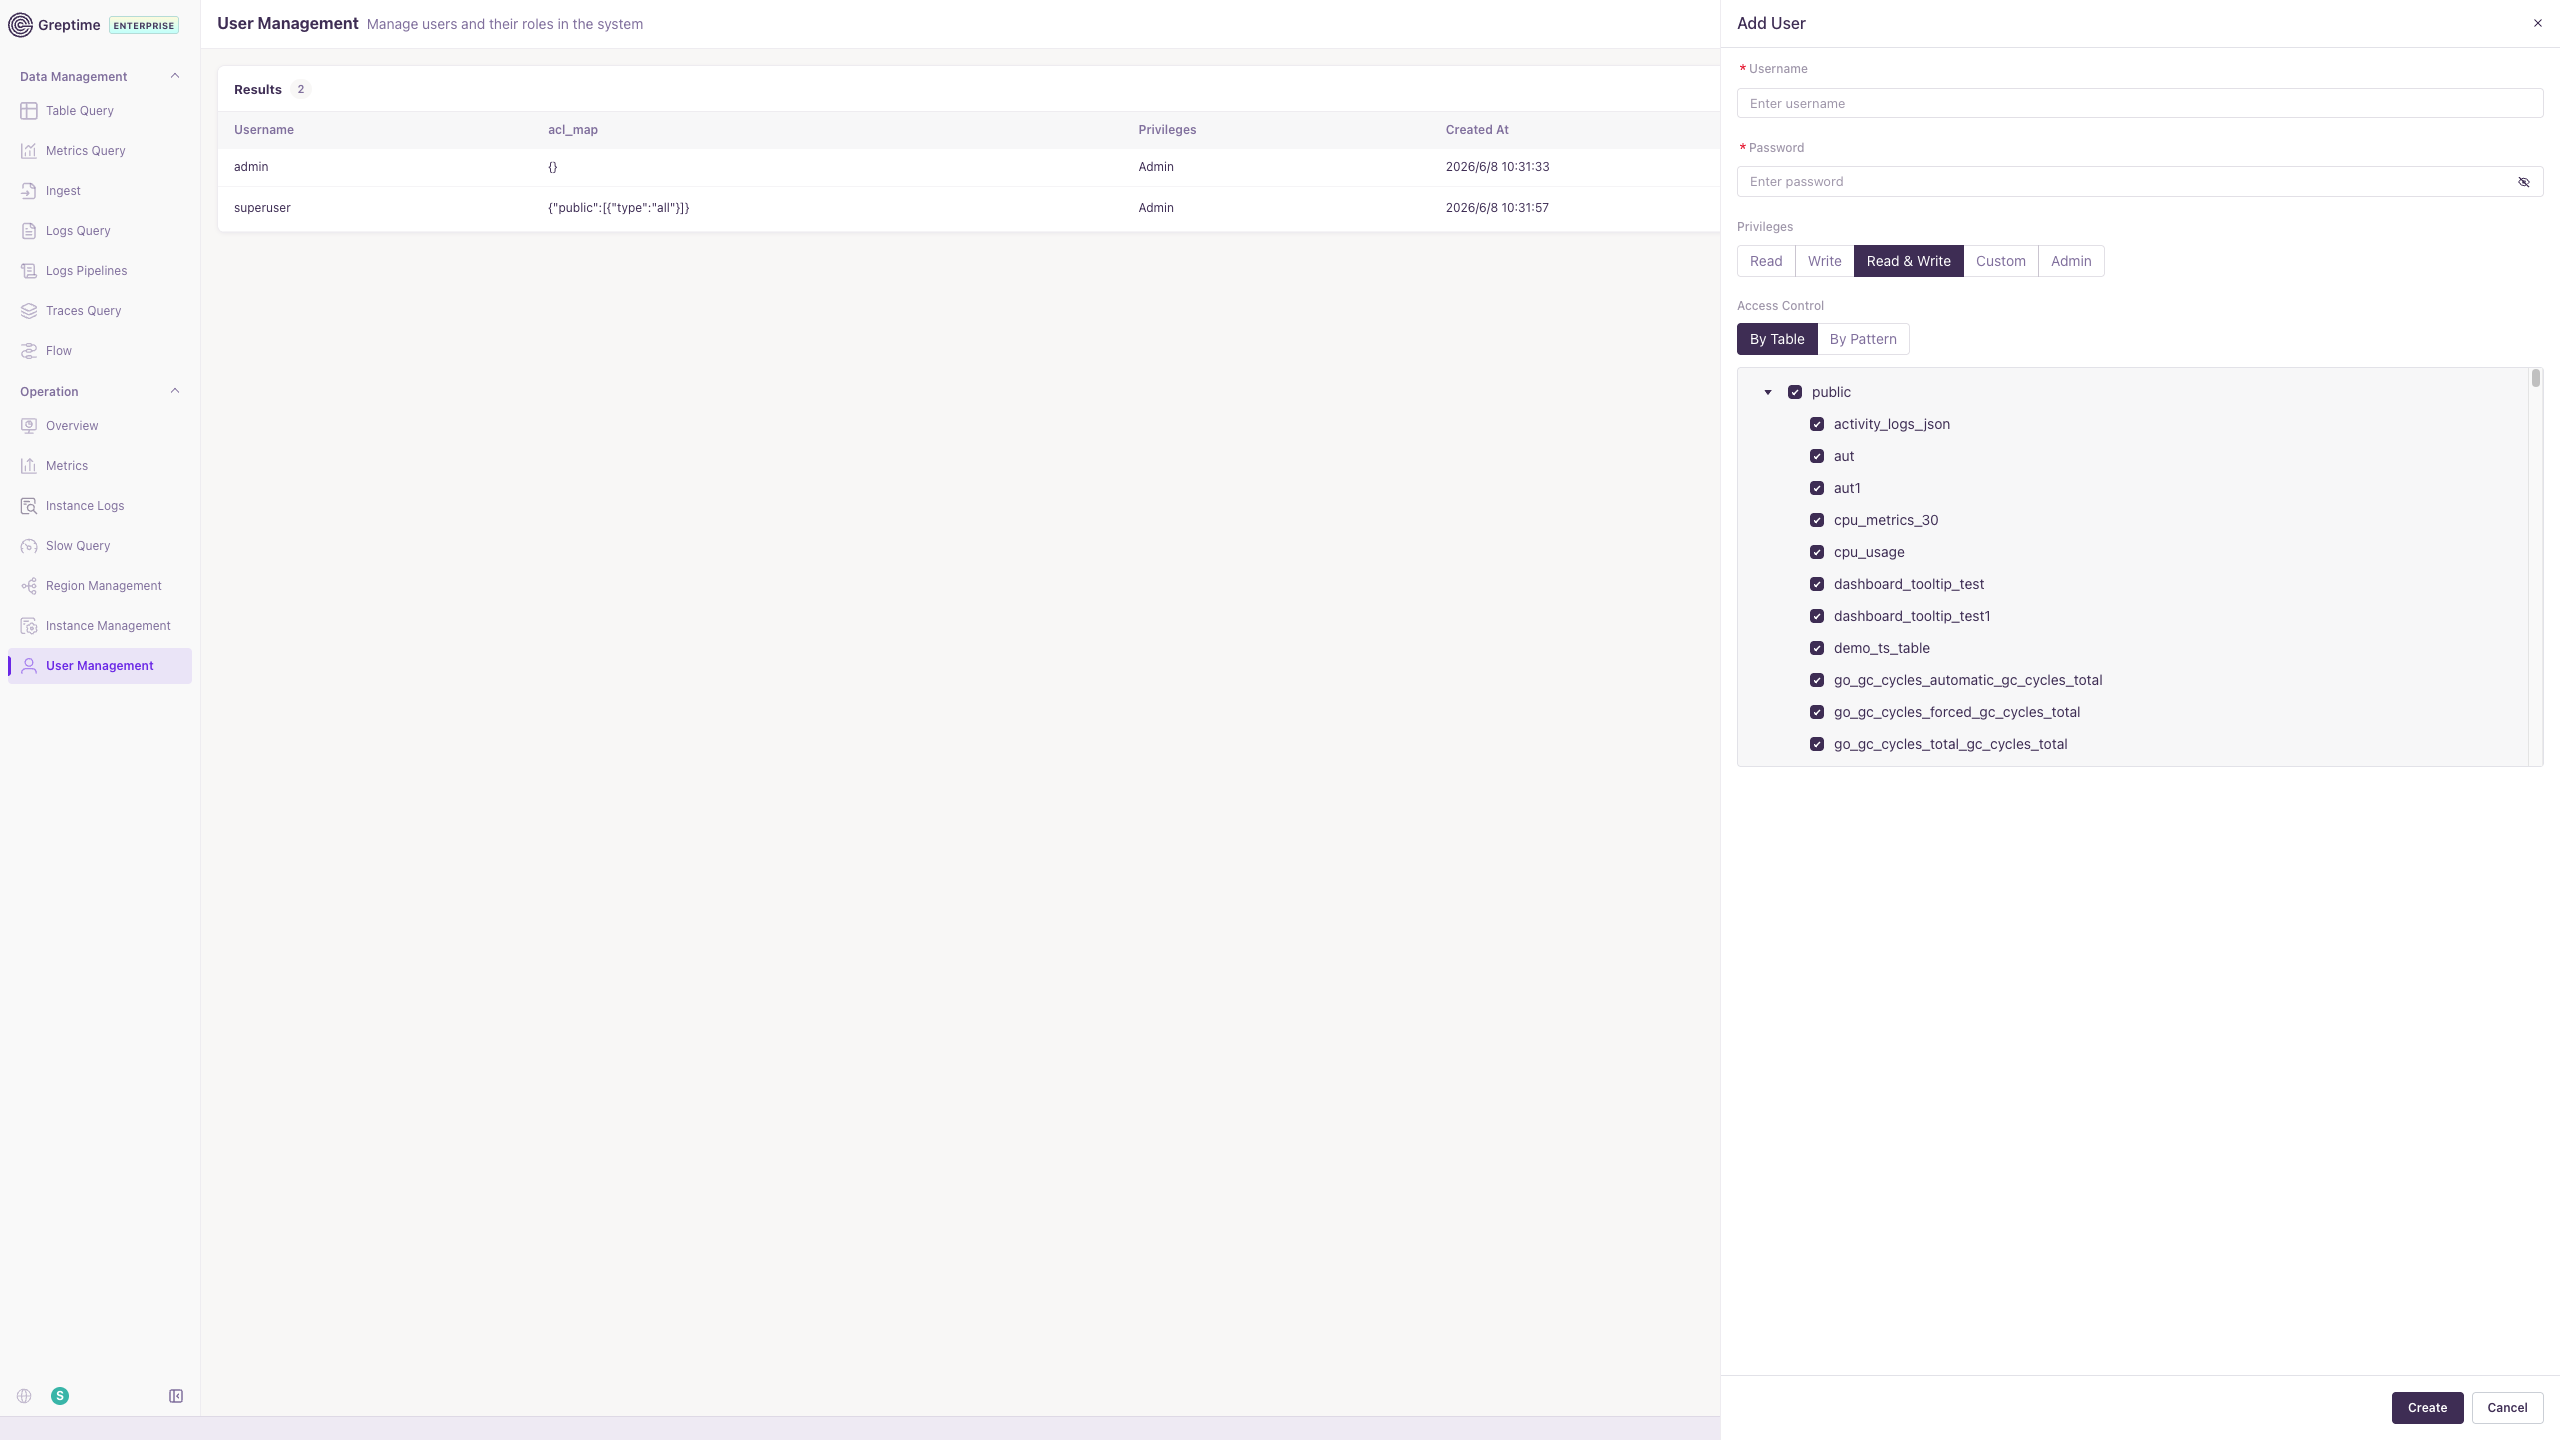
User Management manages user accounts and access control in the console.
- Create users and assign privileges (Read, Write, Read & Write, Custom, Admin).
- Configure table-level ACLs by table or pattern.
- For RBAC and ACL details, see Built-in User Management.
CPU and Memory Profiling
The sidebar provides Memory Profile and CPU Profile entries for continuous profiling of GreptimeDB components. For configuration and usage, see Continuous Profiling. The enterprise dashboard also supports Webhook Triggers for sending notifications based on cluster resource usage metrics.